
Agent Observability Overview
Agent Observability capabilities, instrumentation setup, and monitor types for tracking agent behavior.
Overview
Agent Observability gives you full visibility into your AI agents, from the data that powers them to the prompts they receive and the outputs they generate. Instead of treating agents as black box systems, Monte Carlo provides a unified, end-to-end view across your data pipelines, models, tools, and agent workflows, so you can see exactly what happened, why it happened, and how to fix it.
Every agent run becomes a trace containing prompts, context, completions, token usage, latency, model metadata, errors, and workflow attributes. This level of detail enables teams to systematically evaluate output quality, detect silent failures, identify regressions, monitor cost and performance, and trace issues back to the upstream data or logic that shaped agent behavior.
Trace content — prompts, outputs, and tool calls — is stored in your own environment; Monte Carlo receives span metadata and evaluation scores, and access to raw content is controlled by your data-sharing settings.
What Agent Observability unlocks
Agent Observability gives you Agent Trust: one view across your data and AI, so you can ship production-grade AI and catch failures fast.
- Trusted, production-grade AI with measurable quality
- Detection of subtle regressions, incomplete context, and behavioral drift before users are affected
- Quality evaluation at scale using customizable LLM-as-judge templates or deterministic checks
- Unified root-cause analysis across both data and AI layers
- Faster debugging with trace-level visibility
- Support for any model and any agent framework
- Monitor agents alongside the pipelines and data that feed them
- AI agent (Claude/Cursor/others)-powered monitoring and troubleshooting through MCP and our Agent Toolkit
Agent Trust supports agents you build yourself and platform-native agents running on Snowflake and Databricks. Setup differs by type; everything downstream — Trace Exploration, dashboards, and the full set of agent monitors — is the same either way.
| Your agent | Setup guide |
|---|---|
| Built on any framework, against any model, instrumented with the Monte Carlo SDK or Google ADK | Instrumenting your agent |
| Snowflake Cortex Agents | Snowflake Cortex |
| Databricks Agent Bricks or custom Mosaic AI agents | Agent Bricks and custom agents |
| Databricks AI/BI Genie spaces | AI/BI Genie |
Instrumenting your agent
Instrument your agent with the Monte Carlo SDK — any framework, any model — and every run emits OpenTelemetry (OTLP) traces. For agents built on Google Agent Development Kit (ADK), Google ADK agents already emit them, so you configure ADK to put prompt and completion content on spans instead of adding the SDK.
Those traces land in a self-hosted data platform in your own cloud account: an OpenTelemetry Collector that receives them, and ClickHouse that stores them.
How it works:
- Your instrumented agents emit OpenTelemetry (OTLP) traces via the Monte Carlo SDK.
- The Collector receives and batches the spans, then writes them directly into ClickHouse.
- An LLM worker runs evaluations against that trace data using your cloud's own LLM service, writing results back to ClickHouse.
- Monte Carlo queries ClickHouse through the Monte Carlo Agent — a serverless workload in your account — to power Trace Exploration, monitoring, evaluation, and alerting.
The platform deploys on AWS (Amazon EKS, with Bedrock for evaluations), Azure (AKS, with Microsoft Foundry), and GCP (GKE, with Vertex AI).
Deploying the platform
You deploy the platform into your own account with a single Terraform module, then point Monte Carlo at it. The Agent Observability Data Platform docs are the complete guide — architecture, prerequisites, installation, high availability, and configuration reference for each cloud.
| Step | Where |
|---|---|
| Instrument your agents to emit OTLP traces | Monte Carlo SDK · Agent Toolkit |
| Deploy the platform into your cloud account | AWS | Azure | GCP |
| Connect it to Monte Carlo | AWS | Azure | GCP |
| Monitor — explore traces and create agent monitors | Configuring Agent Monitors |
To automate the first step, use the instrument-agent skill in the Monte Carlo Agent Toolkit. One prompt in your editor — Claude Code, Cursor, and others — installs the SDK, places decorators, and verifies traces are flowing.
Once the platform is deployed, Monte Carlo recognizes your ClickHouse trace table automatically, and once traces for an agent are written to ClickHouse, that agent appears on the Agents page on its own.
Connecting platform-native agents
Snowflake Cortex and Databricks Genie/ML-Flow/Agent Bricks agents emit trace data on their own platform, so Monte Carlo reads it through the warehouse connection you've already configured.
1. Grant access and enable trace storage: What you grant, and whether there's trace storage to turn on, differs by platform — see Snowflake Cortex, Agent Bricks and custom agents, or AI/BI Genie.
2. Register the agent in Settings → Agent Observability → Add, toggle Agent Type to Platform Agent, pick your connection, then select your agent and click Import.
Configuring Agent Monitors
Once you've connected your agent, explore traces and start creating agent monitors — or have the Agent Toolkit's monitoring-advisor skill create them from your editor as monitors-as-code YAML.
Monte Carlo offers specialized types of agent monitors to give you granular control over agent monitoring:
-
Agent Evaluation Monitors: Monitor agent output quality by alerting when agent responses contain hallucinations, fail accuracy checks, or don't meet quality standards.
Creating an Evaluation Monitor -
Agent Metric Monitors: Alert on unexpected changes in agent performance metrics like latency spikes, token usage exceeding budgets, or error rate thresholds.
Creating an Agent Metric Monitor -
Agent Trajectory Monitors: Verify execution order and workflow patterns by alerting when tools are called in unexpected sequences or frequencies.
Creating an Agent Trajectory Monitor -
Agent Validation Monitors: Enforce per-trace and per-span constraints by alerting when individual agent trace fields violate rules like model allow-lists, token limits, or latency thresholds
Creating an Agent Validation Monitor
Automated monitoring setup
Once an agent is registered, the fastest way to get coverage is to let the operations agent do it for you.
Navigate to the agent's Monitors tab and select Set this up for me:
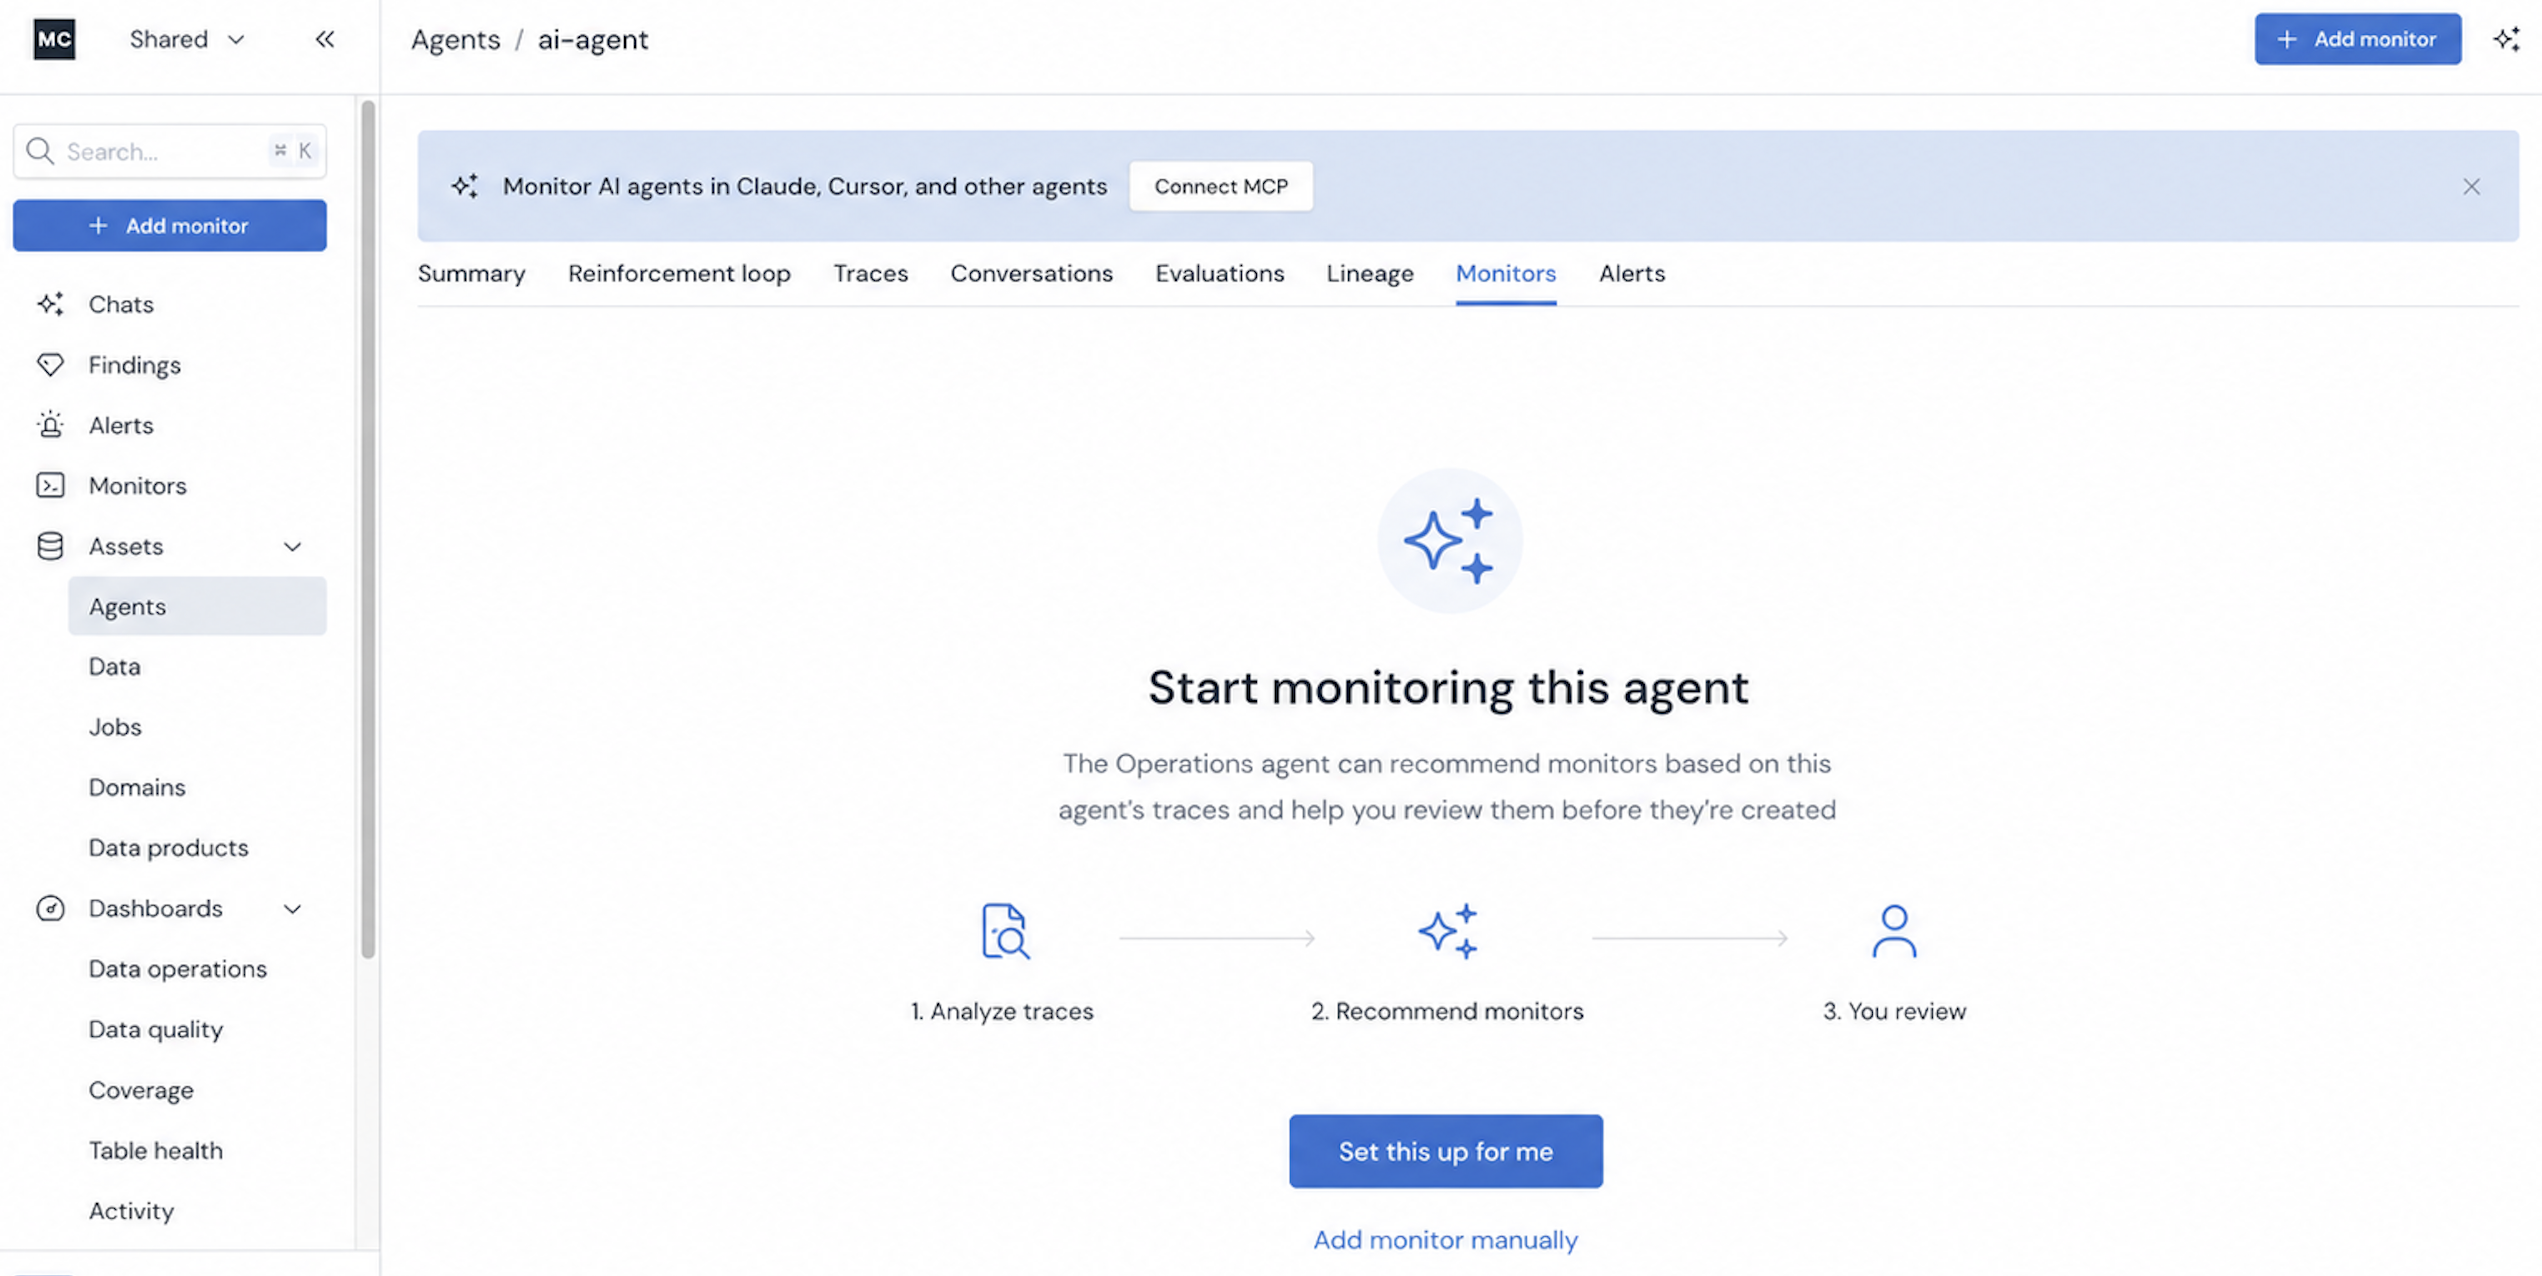
The operations agent analyzes the agent's traces and recommends coverage across the four layers of agent reliability. Each layer catches a different class of failure, and a problem at any one of them breaks the agent — which is why all four matter.
- Context — agents run on data, and that data can be wrong, stale, or late. If a null value shows up upstream, the agent shouldn't be reasoning over it — and you should know before your users do.
- Performance — slow, costly, or erroring agents. A four-minute response means the user is already gone; a single run or tool call costing thousands of dollars is something your team needs to hear about immediately.
- Behavior — agents reason, call tools, and make decisions. Monitoring that sequence tells you when an agent calls the wrong tool, loops, or takes a path it shouldn't.
- Output — an agent can be fast, well-behaved, and fed perfectly good data and still return an answer that doesn't help anyone. Evaluations assess the output itself: helpfulness, quality, user frustration, sentiment, and more.
Recommendations are based on the data present in the agent's traces, so you only get monitors that its telemetry can support.
Use cases and examples
For comprehensive agent monitoring, use all Agent monitor types together: Evaluation Monitors ensure output quality, Metric Monitors ensure operational reliability, and Trajectory Monitors ensure proper execution flow.
| Agent Evaluation Monitors | Agent Metric Monitors | Agent Trajectory Monitors | Agent Validation Monitors | |
|---|---|---|---|---|
| Purpose | Measure output quality and correctness | Track operational health and performance | Validate tool call sequences | Enforce per-trace and per-span field constraints |
| Primary use cases | Hallucination detection, accuracy checks, quality standards | Latency monitoring, cost control, error tracking | Detect dependency issues, recursive calls, unexpected execution sequences | Model allow-list enforcement, token budget guardrails, per-request latency caps |
| What you're monitoring | Agent response quality, accuracy, completeness | Duration, token count, error rate, request volume | Tool call order, execution frequency, workflow steps | Model name, token count, duration, and other trace-level fields |
| Best for | Validating "what" the agent produces | Monitoring "how" the agent performs | Ensuring agents follow expected execution paths | Catching "which" individual traces break the rules |
| Alert examples | "Answer relevance is < 4", "Clarity score is anomalous" | "Max of total tokens is > 1,200", "Mean of duration is > 5s" | "delete_data occurs before check_permissions", "web_search occurs > 5 times" | "Model is not in set 'gpt-5, claude-3, llama-4'", "total_tokens is > 200" |
Updated about 2 months ago