
Dashboarding
Ask Bayes for a dashboard of your Monte Carlo data, check its preview, and save it.
Bayes is Monte Carlo’s AI teammate. It observes your agents and the data that powers them, finds what breaks, proposes and verifies fixes, and gets better at your environment over time.
Bayes builds dashboards of your Monte Carlo data for you: data quality, alerts and incidents, monitoring coverage, credits and monitor runs, across your account or by domain, data product, asset tag or warehouse. That goes well beyond the classic builder, whose widgets cover table metrics, metric monitors and monitor status. Describe the dashboard in your own words, such as "alerts per domain over the last 4 weeks, and how fast we fixed them", or start from an example, and Bayes builds it and previews it on the page.
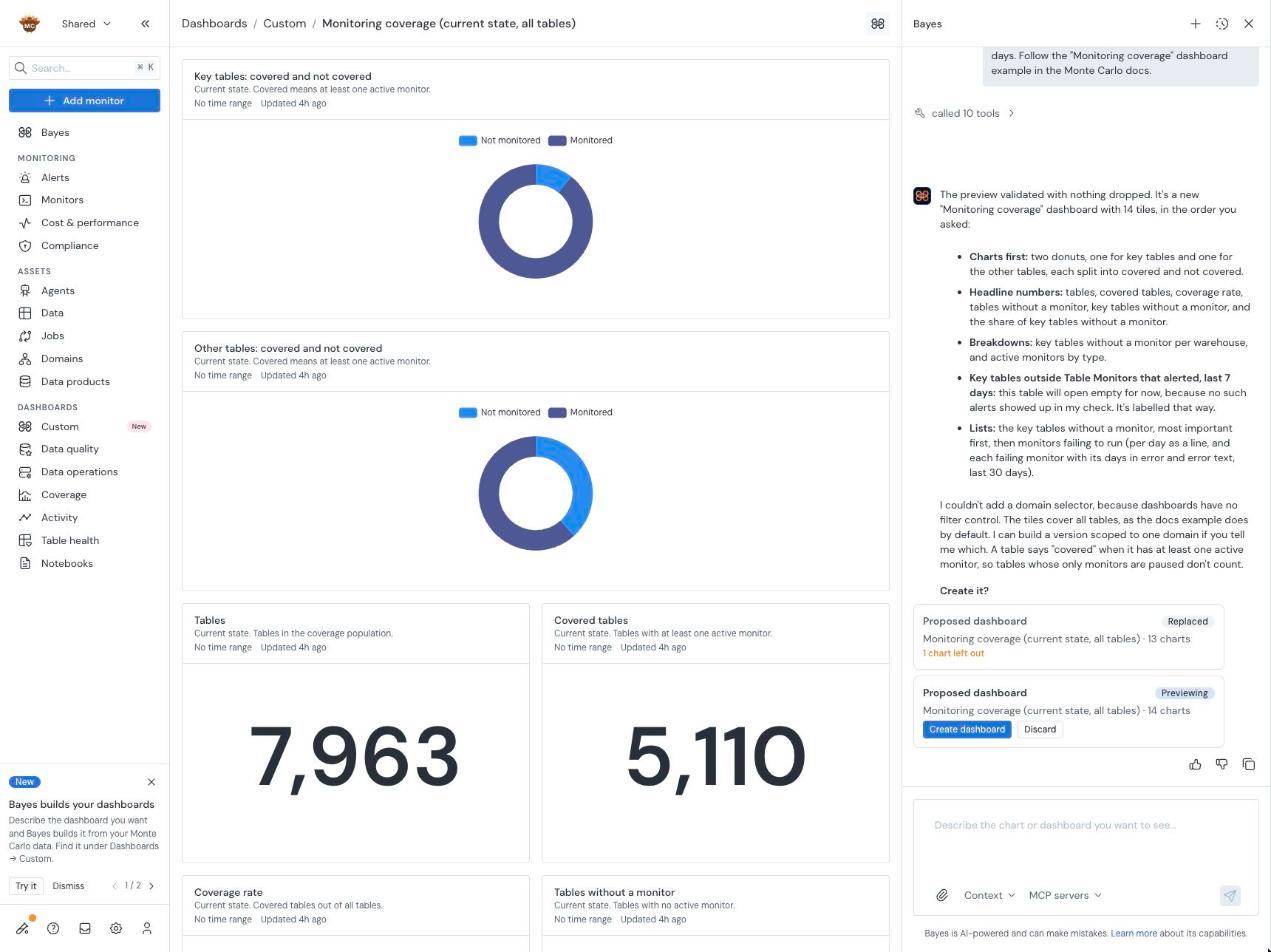
A monitoring coverage dashboard Bayes built from an example, with the Bayes panel open beside it
How it works
You describe the dashboard in the Bayes panel, and Bayes previews it in the middle of the page. Ask for changes until it's right, then save it. To change a saved dashboard later, ask again: Bayes previews each change the same way, and nothing is saved until you confirm.
To skip the previews, tell Bayes to stop asking. It then saves changes and deletes dashboards directly for the rest of that conversation, until you ask it to confirm again. Sharing a dashboard or making it private always asks first.
Every chart uses the same metric definitions as the Analytics API, so the numbers match what your own AI tool shows for the same question.
What you can chart
Bayes charts the metrics in the Analytics API: data quality, alerts and incidents, monitoring coverage, credits and monitor runs. See Querying and the data catalog for the metrics and how to slice them, and Dashboard examples for ready-made dashboards.
A dashboard can have up to 25 charts: numbers, line and bar charts, donuts, tables, status grids, histograms and text.
Each chart covers either a time window or the current state:
- Time windows: charts of activity, such as alerts, cover a time window, such as the last 30 days. Each chart can have its own window, and its title names it.
- Rolling by default: windows move with the day you open the dashboard. To pin a chart to fixed dates, ask Bayes.
- Current state: charts of the current state, such as monitoring coverage, show it as of today.
Each user can have up to 20 saved dashboards.
Accessing Bayes dashboards
Select Dashboards in the left navigation, then Custom. The list has three groups:
- Bayes > Private: Bayes dashboards only you can see.
- Bayes > Shared: Bayes dashboards shared with your account.
- Manual: dashboards built by hand. See Custom dashboards.
Before you have any, Custom opens the Bayes builder.
Bayes dashboards need AI features on for your account. Without them, Custom lists only manual dashboards.
The other dashboards, such as Data quality and Coverage, have a Customize with Bayes button that starts a new Bayes dashboard.
Build a dashboard
- In Custom, select Add with Bayes, or select Customize with Bayes on another dashboard. The Bayes panel opens beside the page.
- Pick one of the examples, or describe the dashboard you want in the Bayes panel. If you can edit custom dashboards, you can select Prefer the classic builder? to build one by hand instead.
- Bayes previews the dashboard in the middle of the page. Ask for changes until it's right.
- Select Create dashboard in the preview card to save it.
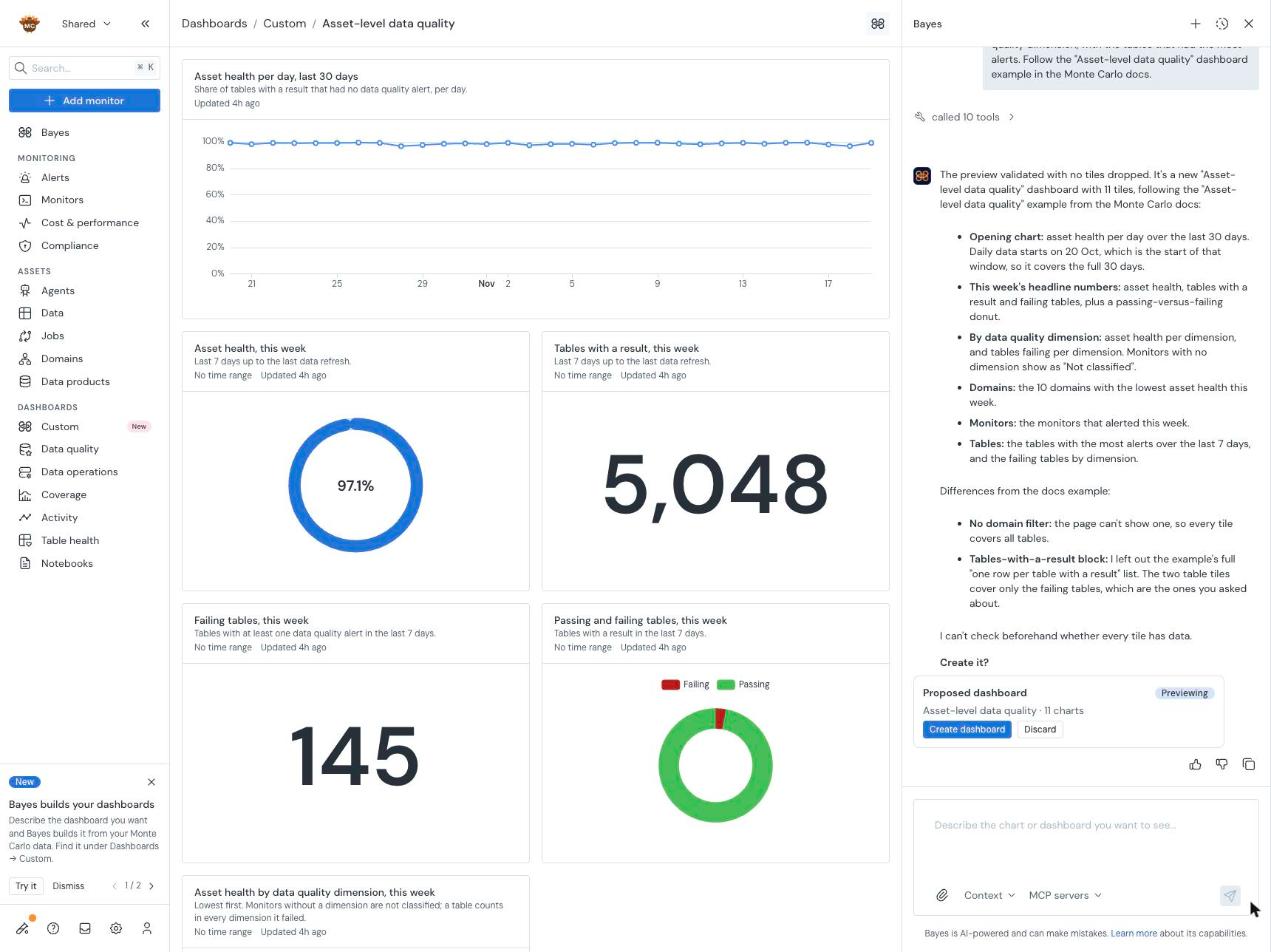
Bayes previews an asset-level data quality dashboard. Nothing is saved until you select Create dashboard
Change a dashboard
Open the dashboard and ask Bayes for the change, such as "add a chart of open alerts by severity" or "switch to the last 7 days". Bayes previews the change on the page and marks what it adds, changes or removes. Select Save in the preview card to keep it, or Don't save. To remove a chart, select Ask the agent to remove in its menu: Bayes drafts the request for you to send. To rename a dashboard of your own, select its title.
If the dashboard changed while you were looking at a preview, nothing is saved: Bayes reads the latest version and proposes the change again.
Share a dashboard
A dashboard is private: only you see it until you share it.
- Share it with your account. In the dashboard's ⋯ menu, select Share with account, or ask Bayes to share it. Everyone in your account can then open it, read-only. A Shared badge marks it.
- Who sees a shared dashboard. A teammate sees it only if they can see every domain its charts filter on. Nobody sees part of a dashboard, and every chart shows each person only the data they can access.
- Make it private again. Select Make private, or ask Bayes. Teammates lose access, including through links you already sent. Copies they cloned stay theirs.
- Change someone else's dashboard. A dashboard someone shared with you is read-only. Select Clone to edit (the copy icon in the header) to get your own private copy, named "Copy of" the original, or ask Bayes for the change and it offers to make the copy for you.
- Copy your own dashboard. In the dashboard's ⋯ menu, select Clone.
Only a dashboard's owner can change, share or delete it.
Link to a dashboard or open it in your AI tool
- Copy link in the ⋯ menu copies a link to the dashboard. It opens for people the dashboard is shared with.
- Open in your AI tool, in the dashboard's header, gives you a ready-made prompt to recreate or adapt the dashboard in Claude, ChatGPT, Cursor or another AI tool connected to the Monte Carlo MCP server.
Delete a dashboard
In the dashboard's ⋯ menu, select Delete, or ask Bayes to delete it. Bayes shows which dashboard it would delete and waits for you to confirm, unless you told it to stop asking.
Deleted one by mistake? Select Undo on the message that confirms the delete, and the dashboard comes back at the same link. If you asked Bayes to delete it, ask Bayes to bring it back.
Access control
To use Bayes dashboards, you need the dashboard/access and dashboard/composable/use permissions. The built-in Viewer and Editor roles include both. Unlike manual dashboards, you don't need dashboard/edit. Admins can restrict Bayes dashboards with a custom role that denies dashboard/composable/use. See Authorization.
Each chart runs with the access of the person viewing it. See Share a dashboard.
Security & data privacy
For more detail on security and data privacy, see the AI Features and Technical Information documentation.
Feedback
Have feedback or requests on Bayes dashboards? Reach out via in-app support.
Updated about 5 hours ago